
“Hey, here’s the log file, the error is in there!” - He told me. How fool I was when I lend him my pendrive, hoping to find the cause for the mysterious error in a couple of minutes. When I got my pendrive back, I realize why he asked me for it: the log file was 5GB lengthy!
Log entries are the trails left by an application. This can easily mislead us to think we need a lot of trails in case of an imminent troubleshooting session. But having a lot of data means nothing if we don’t know the quality of that data. In an ideal world, applications should be logging just meaningful data and this should be tossed in a search engine. No, files are not the best place to store log entries.
Using files to store log entries is a great way to avoid success. While the operations team is busy trying to grant developer access to a remote folder in some production server, the competitor is thinking about business because the developers have access to a dashboard where they can gladly browse any log entry.
The good news: Adam Wiggins wrote an awesome guide for any serious app targeting the cloud. For years The Twelve-Factor App is providing useful insights organized in twelve subjects. The eleventh one is about logs.
The Twelve-Factor App states that logs are event streams. The application writes the events, one per line, to the
stdout. The execution environment collects those events and routes them to an indexing system for further analysis.
Stacks like ElasticSearch/Fluentd/Kibana can easily do all the steps and provides developers a nice dashboard so they
can follow the trails; and business can grow.
Of course this solves just one problem: log availability. The other one is more difficult: log quality. Unfortunately, there’s no such technology capable of delivering quality log entries. The application must be coded to give good trails.
Too bad it wasn’t my case. The log file was full of crap. And I was supposed to find the problem.
I was running out of time to solve that issue, but I managed to do it using tons of grep commands. It was awful, my
head was about to explode. Suddenly, my cellphone rang. It was my friend, JP, asking me for some script that could
filter a log file and remove stacktraces so he could analyze it. Then I realized that I should code something. A tool
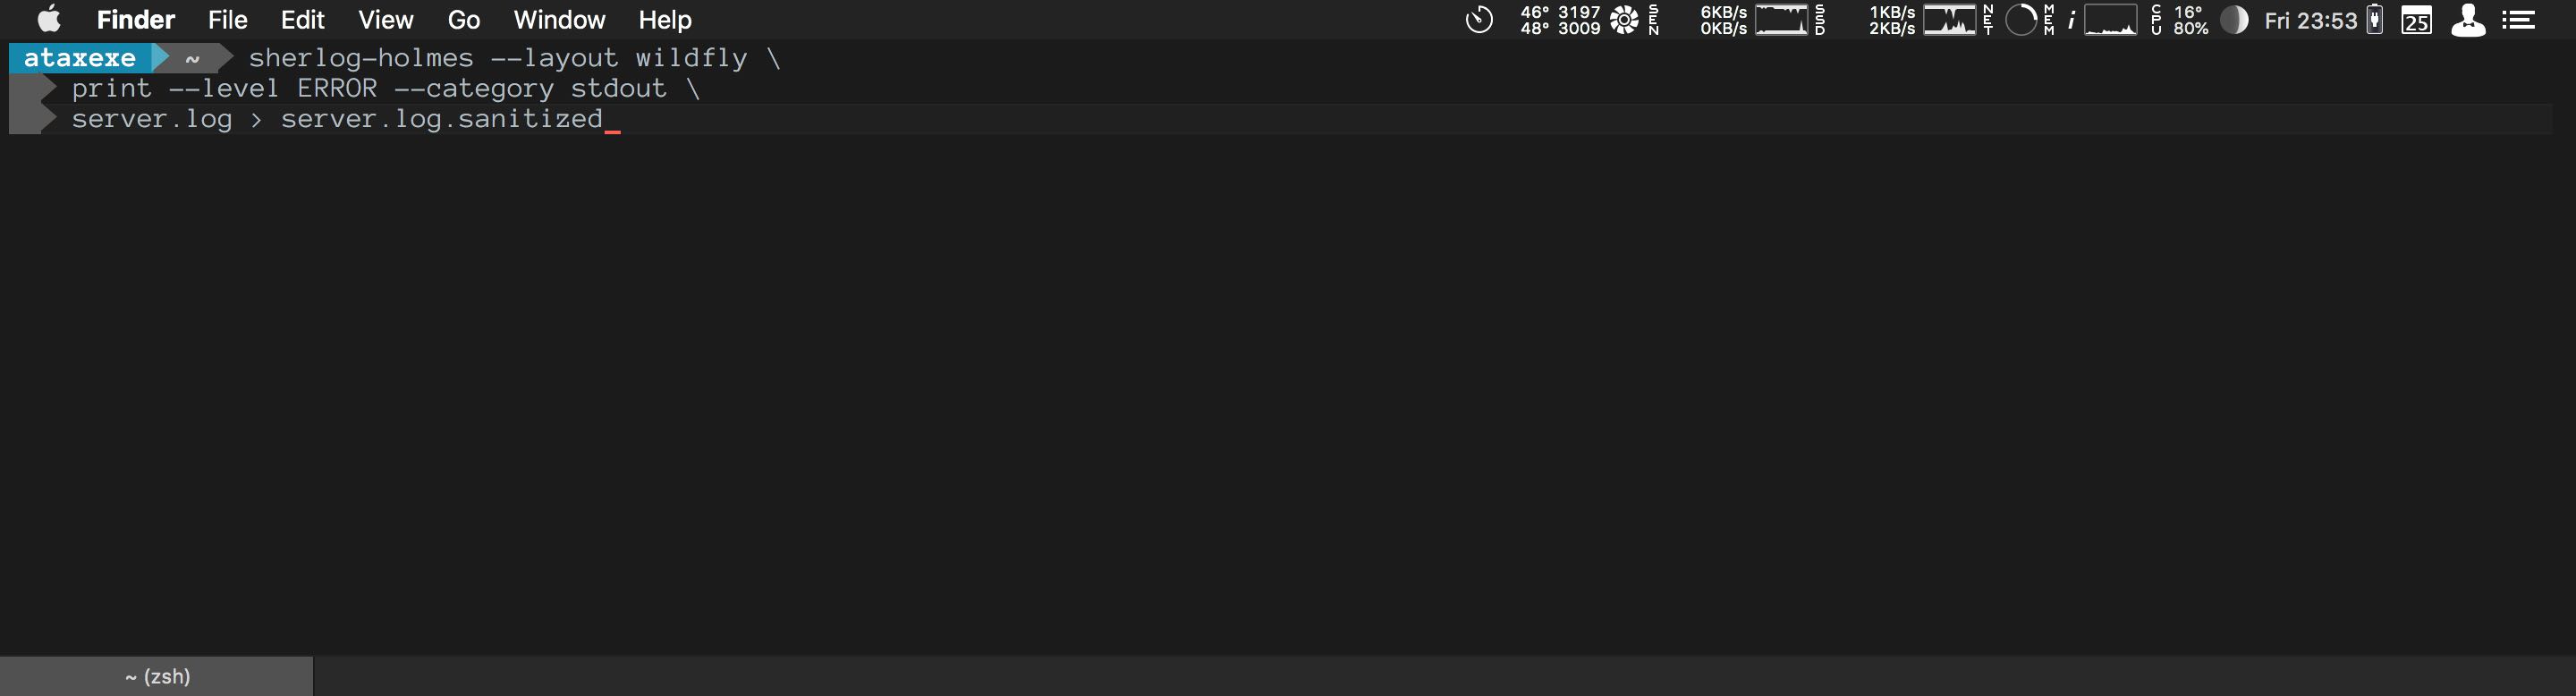
for following trails on log files. The Sherlog Holmes.
The process is kinda simple. Each entry in the file is converted to an entry structure, passed through a set of user
defined filters and only the filtered entries are processed. The process can be a simple write to the stdout, useful
to reduce the size of the log file; or a count that aggregates levels, exceptions, categories, etc., useful to get an
overview of the log, specially when exceptions are present.
I often need to tell people things like “you have 42 occurrences of a NullPointerException so please try to fix that
before saying Java has a bug in the for loop”. Seriously, I’ve been through something like this and it was really hard
to not pull off my left arm just to have something to throw at the complainers.
This is awkward. I really don’t know why some folks are afraid of logs. Log entries are a simple structure. We can split a log entry into four parts that have great impact on the log quality: timestamp, level, category and message.
The timestamp represents the timeframe in which the event occurred. Without it, we can’t recreate the timeline to get
a better view of the scenario.
The level represents how informative is the event. Every runtime defines its own set of possible levels like
under-the-hood information (e.g. TRACE and DEBUG), generic information (e.g. INFO) and alerts (e.g. WARN and
ERROR). Using concise log levels helps us to define which of them will appear in the log stream.
The category aggregates the events using any meaningful convention. The runtime can define a generic category in case
the developer didn’t specify one. Of course this should never happen because the category is a great field for filtering
events. It’s easy to search for errors on the payment module if those are indexable log parts, for example.
The message is the description of the event. It should be short and straight to the point. Depending on the
programming language, exceptions might appear here, which makes a good filter too.
Sherlog Holmes was my attempt to do filtering on those parts when a log stack is not present, which means log files everywhere. Reading those logs are now an easy task and also helps me to solve the log quality problem. How? Simple: reading helps writing.